
17 posts
Posted 18 March 2015 - 06:06 AM
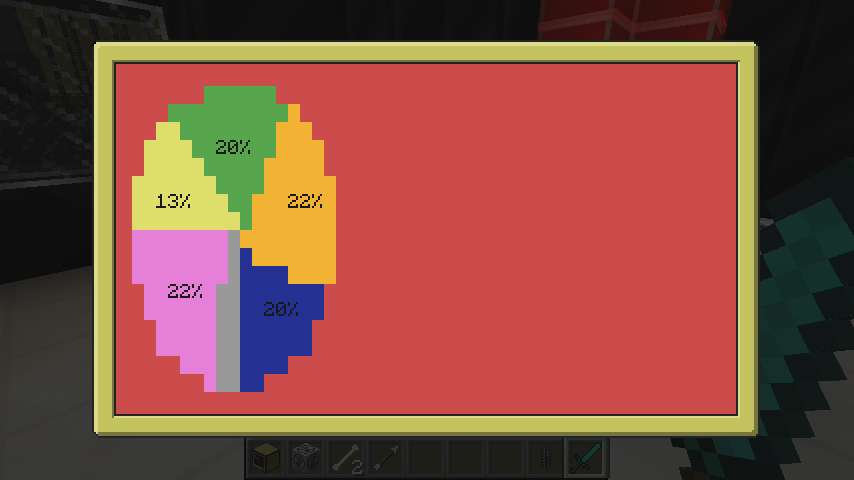
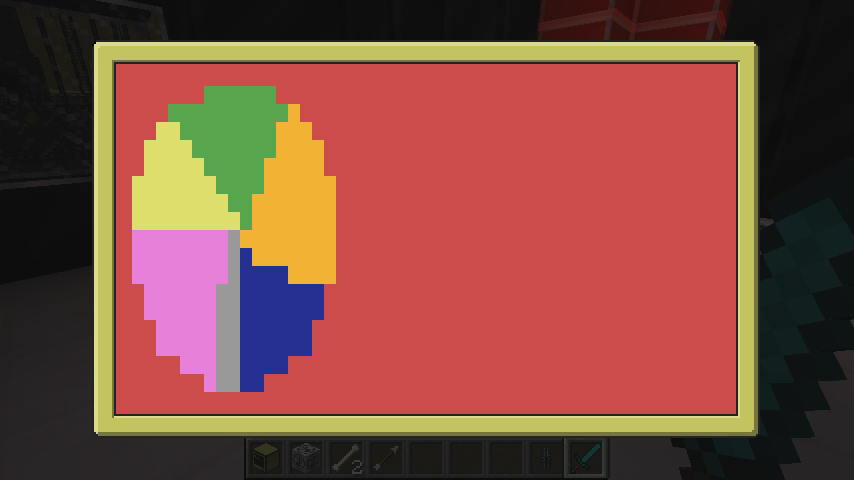
This is a pie chart object with multiple slices of various colours filled or unfilled circles
Requirements:
Installation:
Create an Object in your View file of Type="Circle" or AddObject
Select a Subtype default is Circle if omitted
Subtype="Circle" or "Pie"
Set Colours for Text with
TextColour
Set Colours for subtype Circle with
ActiveColour
Set the Colour used to fill whatever is left of the Pie with
BackgroundColour
Whether or not to fill the Circle/Pie
Filled=true or false
The size of the Circle/Pie
Radius=# Max viewable by width is 22 Max viewable by Height is 8
Note:
DO NOT SET HEIGHT OR WIDTH UNLESS YOU WANT TO INTENTIONALLY CLIP THE CIRCLE
The setup for a pie is a little different if you want a single slice Pie you can do
If you want multiple slices you need to create a Percentages Table of the following format and assign it to
Screenshots:
 Hope you enjoy it and find it useful, I'm going to possibly add Ellipses in the future and fill percentage say if you want a 2 pixel outline rather than one etc.
Requirements:
- Bedrock a GUI API by Oeed
- Circle.lua http://pastebin.com/RnHgvL5S
Circle.lua
--[[Example percentages array
local percentages={
  {
  Percentage=12,
  Colour=colours.red
  },
  {
  Percentage=30,
  Colour=colours.blue
  },
  {
  Percentage=25,
  Colour=colours.green
  }
}]]
BackgroundColour = colours.lightGrey
ActiveColour = colours.blue
Percentages = {
		{
		Percentage=10,
		Colour=ActiveColour
		}
}
Filled = false
TextColour = colors.black
Radius = 1
SubType = "Circle"
ShowText = false
OnDraw = function(self,x,y)
self.Height = self.Radius * 2+10
self.Width = self.Radius * 2+10
	if self.SubType == "Circle" then
	 drawCircle(x,y,self.Radius,self.ActiveColour,self.Filled)
	elseif self.SubType == "Pie" then
	 drawPie(x,y,self.Radius,self.Percentages,self.Filled,self.BackgroundColour)
	end
end
function drawCircle(StartX, StartY, radius, colour, filled)
local Filled = filled or false
local percentages={
  {
  Percentage=100,
  Colour=colour
  }
}
ShowText = false
local BGColour = colour
drawPie(StartX,StartY,radius,percentages,Filled,BGColour)
end
function drawPie(StartX,StartY,radius, percentages, filled,BGColour)
local Filled = filled or false
local Radius = radius
local CenterX = math.floor(radius + StartX)
local CenterY = math.floor(radius  + StartY)
local first = true
local lastPercentage = nil
	--calculate arc
	for key, value in next, percentages do
	  theta = nil
	  if first then
		theta = 0
		first = false
	  else
		  theta = lastPercentage
	  end
	  lastPercentage = theta + math.rad((value.Percentage/100)*360)
		--[[check if somebody added an element pushing us past 100%]]
		if lastPercentage > math.rad(360) then
		  --[[undo that and break this loop let us finish up.]]
		  lastPercentage = lastPercentage - math.rad((value.Percentage/100)*360)
		  break
		end
		if ShowText and Filled then
		  --[[use start and end radian values to get starting/ending x-y
		  cumulative based on how many slices]]
		  segX2 = CenterX + Radius * math.sin(lastPercentage)
		  segY2 = CenterY + Radius * math.cos(lastPercentage)
		  segX1 = CenterX + Radius * math.sin(theta)
		  segY1 = CenterY + Radius * math.cos(theta)
		  --[[get centerpoint of arc called c]]
		  c = math.atan2(segY1-segY2,segX1-segX2)
		  --[[get proper quadrant based on ending angle
		  atan2 should get this automagically apparently not however]]
		  if(c - lastPercentage)<-math.pi then
		  --[[notice their not really midpoint of the radius
		  adjusted slightly to make it look prettier.]]
		  --[[compensate for negative x values in relation to centerpoint
		  if it was 0,0]]
		  textX = CenterX + (Radius/1.3) * math.sin(c-2*math.pi)
		  --[[flip y value atan2 seems to be interpreting a wrong 0 point]]
		  textY = CenterY + (Radius/1.5) * math.cos(c-math.pi)
		  else
		  textX = CenterX + (Radius/1.5) * math.sin(c)
		  --[[flip y value atan2 seems to be interpreting a wrong 0 point]]
		  textY = CenterY + (Radius/1.5) * math.cos(c-math.pi)
		  end
		end
	  --draw arc
	  while theta <= lastPercentage do
		x = CenterX + Radius * math.sin(theta)
		y = CenterY + Radius * math.cos(theta)
		  if Filled then
			drawLine(CenterX,CenterY,x,y,value.Colour)
		  else
			Drawing.WriteToBuffer(x, y," ",colours.white,value.Colour)
		  end
		theta = theta + 0.01
	  end--end drawing arc
	  --[[Draw based on calculations for midpoint we got before drawing the
	  slice that way we don't end up drawing underneath]]
	  if ShowText and Filled then
		Drawing.DrawCharacters(textX, textY, value.Percentage.."%", TextColour, value.Colour)
	  end
	end--end calculating arc
	--finish drawing circle
	if lastPercentage < math.rad(360) then
	  theta = lastPercentage
		while theta < math.rad(360) do
		  x = CenterX + Radius * math.sin(theta)
		  y = CenterY + Radius * math.cos(theta)
			if Filled then
			  drawLine(CenterX,CenterY,x,y,BGColour)
			else
			  Drawing.WriteToBuffer(x, y," ",colours.white,BGColour)
			end
		  theta = theta + 0.01
	  end--end drawing arc
	end--end finish drawing circle
end
function drawLine(x1,y1,x2,y2,colour)
  for i = 0,1,0.03 do
	x = (x2-x1)*i + x1
	y = (y2-y1)*i + y1
	Drawing.WriteToBuffer(x,y," ",colours.white,colour)
  end
end
local function ParseColour(value)
  if type(value) == 'string' then
	if colours[value] and type(colours[value]) == 'number' then
	  return colours[value]
	elseif colors[value] and type(colors[value]) == 'number' then
	  return colors[value]
	end
  elseif type(value) == 'number' and (value == colours.transparent or (value >= colours.white and value <= colours.black)) then
	return value
  end
  error('Invalid colour: "'..tostring(value)..'"')
end
OnUpdate = function(self,value)
  if value == 'Percentages' then
	for key, subvalue in pairs(self.Percentages) do
	subvalue.Colour = ParseColour(subvalue.Colour)
	end
  end
end
Installation:
- Copy code in spoiler to a file named Circle.lua place that in Objects folder of the CC Computer you wish to use it on
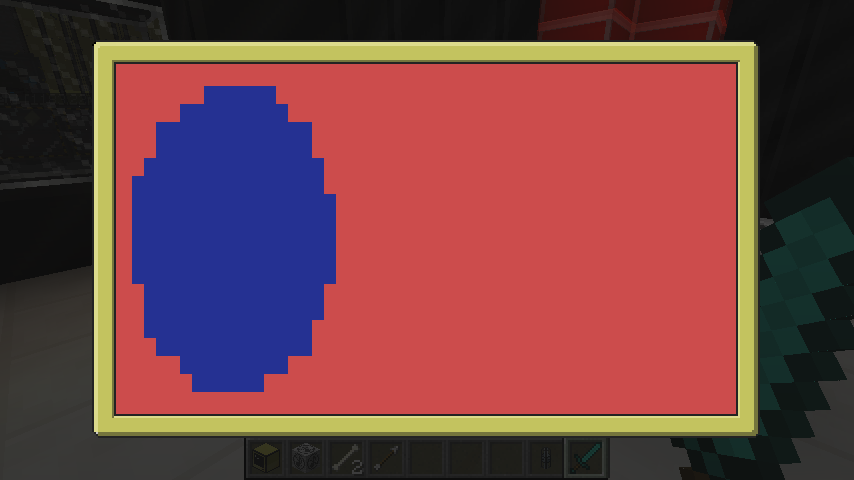
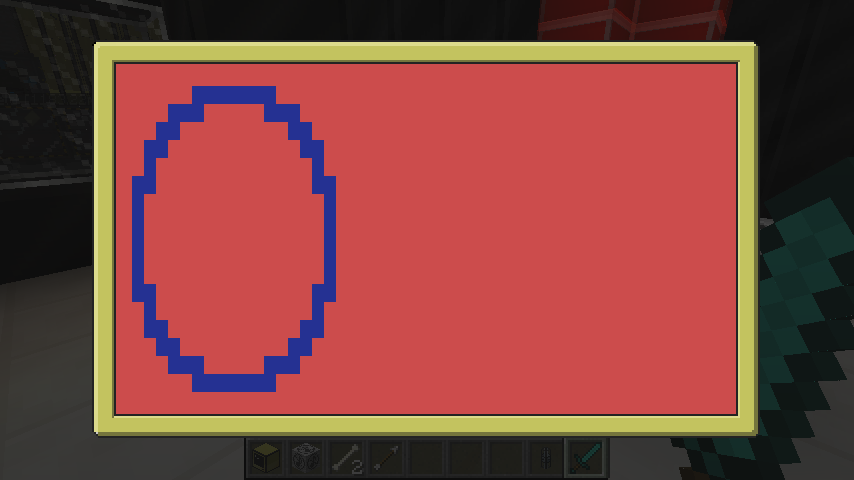
- Filled or Unfilled circles of various colours simply initialize a Circle object to see the default blue unfilled circle
- Pie charts containing one or more sections of various colour with optional percentage labels also with custom colour
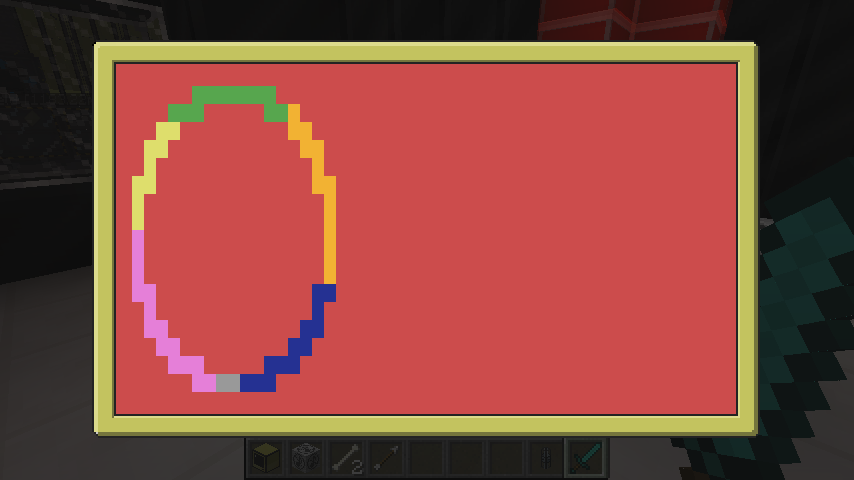
- Unfilled pie charts resulting in a rainbow circle(For whatever reason just wanted to keep that cause it seemed useful for something kinda like a Conkey Widget
Create an Object in your View file of Type="Circle" or AddObject
Select a Subtype default is Circle if omitted
Subtype="Circle" or "Pie"
Set Colours for Text with
TextColour
Set Colours for subtype Circle with
ActiveColour
Set the Colour used to fill whatever is left of the Pie with
BackgroundColour
Whether or not to fill the Circle/Pie
Filled=true or false
The size of the Circle/Pie
Radius=# Max viewable by width is 22 Max viewable by Height is 8
Note:
DO NOT SET HEIGHT OR WIDTH UNLESS YOU WANT TO INTENTIONALLY CLIP THE CIRCLE
The setup for a pie is a little different if you want a single slice Pie you can do
Spoiler
program:GetObject('testCircle').Percentages[1].Percentage = # between 1-100
program:GetObject('testCircle').Percentages[1].Color = A Colour string or CC colour
If you want multiple slices you need to create a Percentages Table of the following format and assign it to
{
Percentages={
Percentage=# between 1-100,
Colour= A Colour string or CC colour
}
}
--[[add more associative tables for each slice
REMEMBER THAT IF YOU ADD SLICES AMOUNTING TO OVER 100 ANY THAT MAKE THE TOTAL GREATER THAN 100 WILL NOT BE DRAWN]]
program:GetObject('testCircle').Percentages = myTable
Screenshots:
Spoiler